

Convert Boring Data Into Structured infographics
Discover more

Convert Boring Data Into
Structured infographics
Discover more


Annual Report
Winning the trust of stakeholders by designing annual report of your company with infographics and information curated effectively.

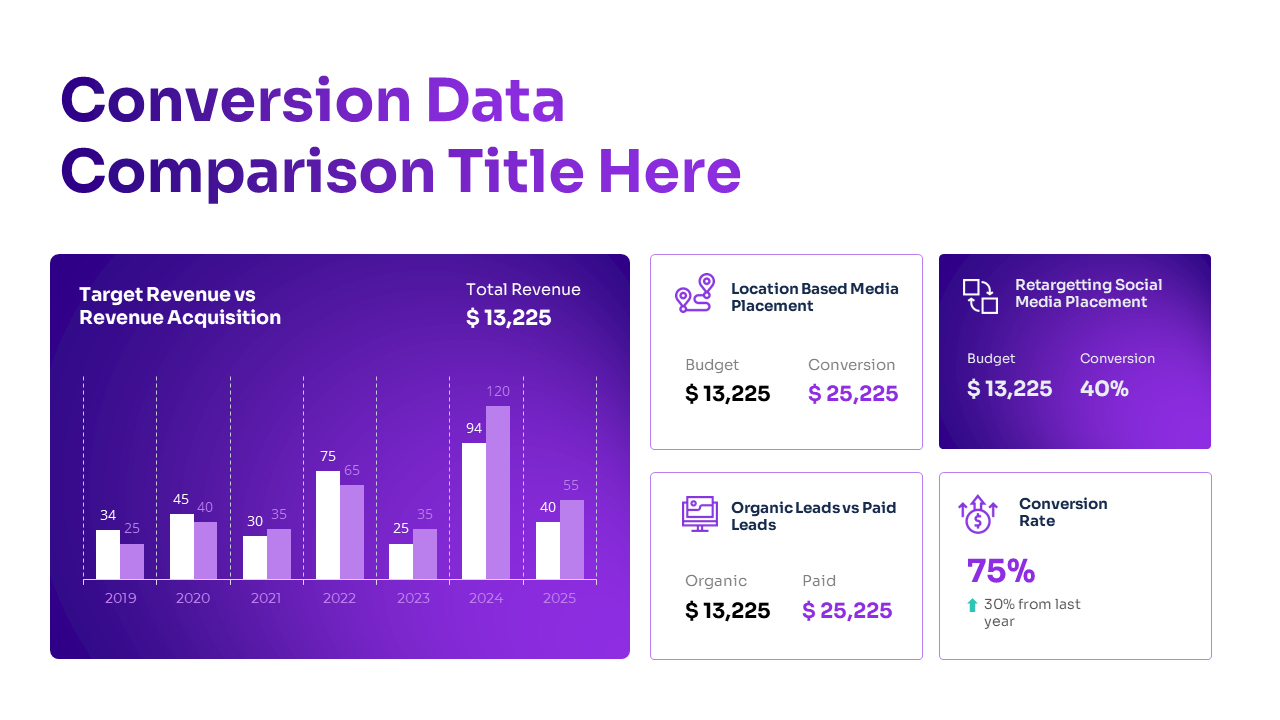
Financial Report
Summarizing the financial activity of the organization in better charts and graphs for better decision making.

White Paper
Improving the efficiency of lead magnet by carefully crafting days of research into stellar visuals.
Decks for Ideas Worth
Million Dollars
Due to confidentiality, details are limited. Contact us.
Socio Metrics-
-Report
Platform transforming your social data into understandable visualizations

Learn More
Due to confidentiality, details are limited. Contact us.
Socio Metrics-
-Report
Platform transforming your social data into understandable visualizations
Learn More
Due to confidentiality, details are limited. Contact us.
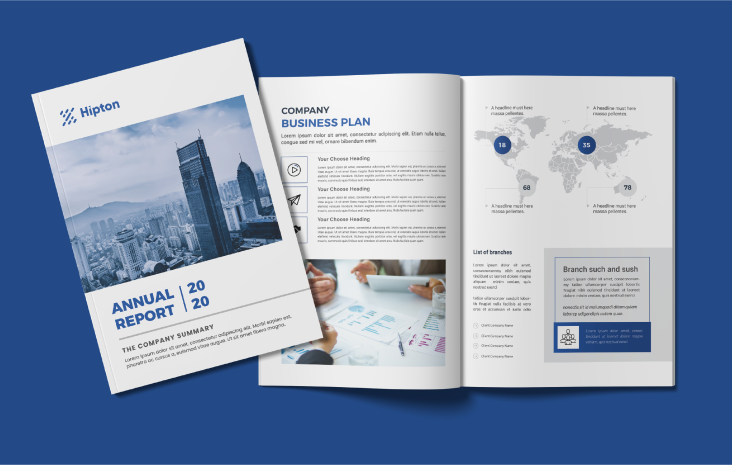
Hipton-
-Report
A manufacturing unit showcasing its annual growth to all the stakeholders.
Learn More
Due to confidentiality, details are limited. Contact us.
Hipton-
-Report
A manufacturing unit showcasing its annual growth to all the stakeholders.
Learn More
Optimized Process
For Quality Output
Optimized Process
For Quality Output

Discovery Calls To
Understand The Vision
Discussing goals and objections with the right set of questions to understand your needs.
This process ensures we fully grasp your vision, goals, and requirements to create an impactful Report Design.
Goal Identification
Clarifying your objectives for the report.
Vision Alignment
Ensuring your vision aligns with the report purpose.
Content Requirements
Determining the necessary content and supporting materials.
Timeline
Establishing a realistic timeline for project milestones and delivery.
Budget
Aligning the report design process with your budget constraints.
Expectations
Setting clear expectations for the design and content.

Designing the Skeleton
of the Presentation
Identifying the key message to decide the structure of the presentation.
This process lays a solid foundation for a well-structured and impactful report.
Key Message
Gathering user insights and research data.
Content Outline
Identifying key patterns and user needs.
Flow & Structure
Creating initial sketches and lo-fi wireframes to visualize ideas.
Slide Layouts
Iterating designs based on user testing and feedback.
Visual Elements
Refining wireframes to ensure clarity and usability.
Feedback Loop
Incorporating initial feedback to refine the structure.

The First
Design Draft
Creating a design draft with curated content based on branding guidelines.
This draft serves as the initial visualization of your report, aligning with your brand and objectives.
Curated Content
Incorporating the finalized content as per your requirements.
Branding Guidelines
Adhering to established branding standards for consistency.
Design Elements
Applying design elements such as typography, colors, and imagery.
Slide Layouts
Designing individual slides based on the outlined structure.
Visual Hierarchy
Ensuring a clear visual hierarchy to emphasize key points.
Initial Review
Presenting the draft for feedback and making necessary adjustments.

Final Design
Based on Draft
Designing the presentation from start to end with the finalized draft.
This stage delivers a polished, cohesive pitch deck ready for delivery.
Complete Design
Selecting diverse user groups representing your target audience.
Consistency
Developing scenarios to test various aspects of the design.
Content Integration
Observing users interact with the design to identify pain points.
Visual Refinement
Gathering detailed feedback from each user group.
Interactive Elements
Detecting and addressing any issues or errors.
Final Review
Continuously refining the design based on testing results.

Delivery & Support for
Hassle-Free Experience
Delivering the final version in the desired format and helping out in case of minor edits.
This ensures a smooth transition from design to delivery with continued support for a hassle-free experience.
Final Delivery
Providing the report in your preferred format (e.g., PPT, PDF).
Format Conversion
Assisting with any format conversions if needed.
Minor Edits
Offering support for minor revisions or updates.
Technical Assistance
Helping with any technical issues related to the report.
Usage Guidance
Providing instructions on how to use and present the content.
Post-Delivery Support
Being available for any additional questions or adjustments
Frequently
Asked Questions (FAQs)

How soon can I expect my Report to be completed?
Does the cost vary with the number of slides in my report?
How do you ensure the security of my data?
Do you offer content creation services if I don’t have any prepared material?
What software will be used for the report, and can I make changes myself?
How will you determine the design style that suits my preferences?
Have an idea ?

Let's Create The Design
Select Service
Our Global Presence
Inc Design Agency is a one-stop design solution for businesses by providing services like deck designing, Ui/UX and report designing.